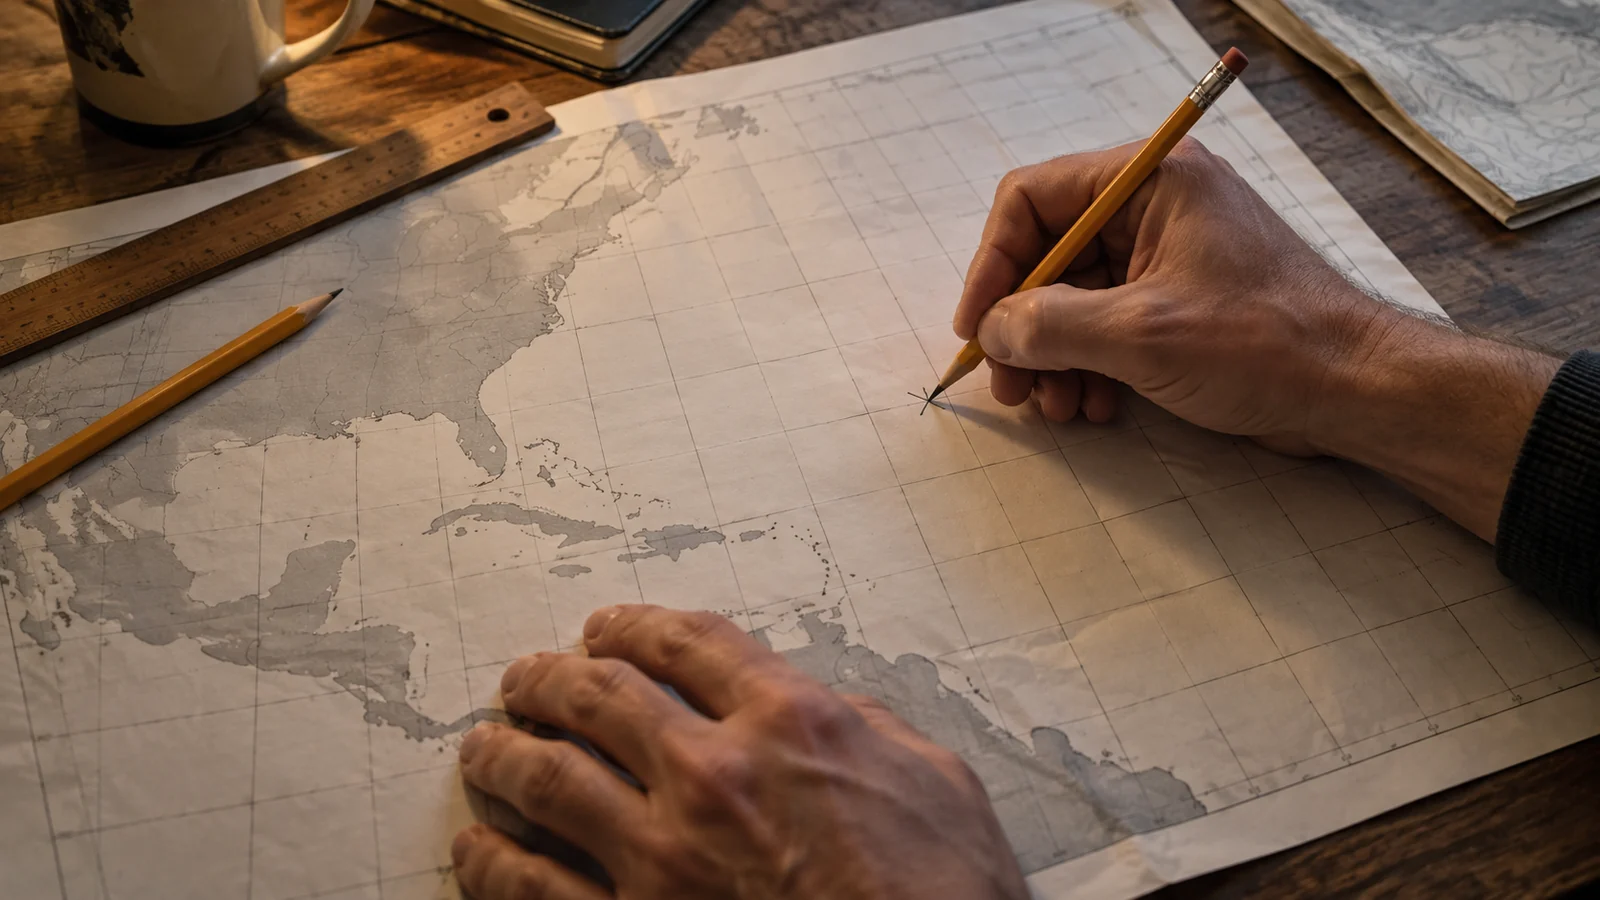

A hurricane tracking chart is a sheet of paper with a latitude and longitude grid on it, and a pencil. It sounds quaint until the power has been out for two days and the phone is at eleven per cent.
It is also the only way to actually understand a forecast rather than glance at it, which is why they've been handed out in coastal schools for decades.
Why Paper Still Wins
Three reasons, and none of them is nostalgia.
It works without power. A hurricane's first effect on most households is the outage, and the outage is what makes every screen a countdown. A chart and a pencil work by candlelight — though the light should be battery, per Emergency Lighting & Lanterns.
It works with a radio. Advisories are read out on NOAA Weather Radio with coordinates, wind speed and pressure. If the internet is gone but the radio still works, a chart turns spoken numbers into a picture. That combination is the whole argument, and the radio side is in NOAA Weather Radios.
It makes you look at the movement, not the headline. Plotting six positions by hand shows you the speed, the turn and the trend in a way that a glance at an animated graphic does not. People who plot tend to understand what "slowing down" means for rainfall.
A free hurricane tracking chart is also the least commercial thing on this site. Ours needs no email address, and neither should anyone else's.
How to Plot One
The mechanics take about a minute to learn.
Each advisory gives a position as latitude north and longitude west — for example 24.5 N, 78.2 W. Find the latitude on the vertical scale, the longitude on the horizontal, and mark the intersection with a small cross. Write the advisory time beside it.
Add the maximum sustained wind and the central pressure next to the mark, or in the table. Those two numbers are where the story is: falling pressure and rising wind means intensifying, and you will see it before any headline says so.
Join the marks with a light line as you go. After three or four advisories you have a track, and the spacing between marks tells you the forward speed — which matters enormously, because a slow storm rains on one place for far longer.
One discipline: plot what the advisory says, not what you expect. The temptation to smooth a wobble into a curve is real, and the wobble is often the information.
Printing It, and Where to Keep It
Print several. A hurricane tracking chart pdf costs nothing to reproduce, and one per storm keeps the tracks from overlapping into a mess.
Keep them somewhere dry with a pencil — the supply box rather than a drawer. A pencil beats a pen, because paper in a humid coastal house in September does not love ink, and because you will want to erase.
Print them before the season, not when a storm has a name. Printers are the most reliably useless appliance in any household emergency, and the shops that sell ink close early when everyone else is boarding up.
If you'd rather follow the official graphics on a screen while the power lasts, Hurricane Tracker & Live Map explains what each product actually shows — particularly the cone, which is the most misread graphic in American weather.
And the chart is a companion to the plan, not a substitute for it: Hurricane Preparedness is the part that has to happen whatever the track does.
Print three copies this week and put them with the torch. That's the whole job.
FAQ: Printable Hurricane Tracking Chart
What is a hurricane tracking chart?
A printed map with a latitude and longitude grid, used to plot a storm's position by hand from each advisory. It works without power or internet.
How do I use one?
Take the latitude and longitude from the advisory, mark the intersection with a cross, note the time, wind speed and pressure, and join the marks as new advisories arrive.
Where do I get the position data?
National Hurricane Center advisories, including the ones read out on NOAA Weather Radio — which is why a chart and a battery radio work together when everything else is down.
Can I use my plot to predict where it's going?
No. It's a comprehension aid, not a forecast, and it must never be used to argue against an evacuation order. Extending the line yourself is exactly what the official forecast exists to do properly.
Why a pencil rather than a pen?
Humid coastal air and ink don't mix, and you'll want to erase. Keep a pencil with the charts rather than hunting for one later.
Is the chart free?
Yes. No email address, no account, nothing bundled. Every printable on this site works the same way.
Sources
- NOAA National Hurricane Center — advisory format, position, wind and pressure reporting
- NOAA — public tracking chart conventions for the Atlantic basin
- National Weather Service — NOAA Weather Radio advisory broadcasts
A hand-plotted chart is not a forecast. When a warning is active or an order is issued, follow local authorities, the National Hurricane Center and emergency services before any general guidance. See our Editorial Policy and Sources & Fact-Checking.